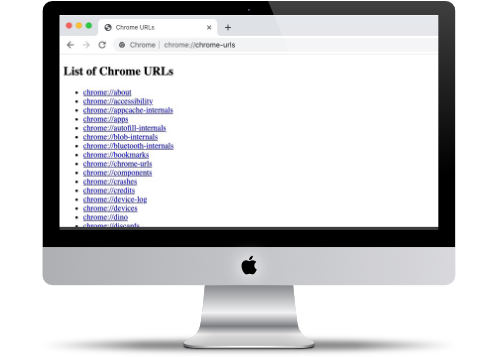
Google Chrome URL Page
Useful page of all the Chrome Debugging tools
Google Chrome has a lot of useful built-in debugging tools. You can access many of these via single page URL Cheat Sheet:

Type this in the Browser URL field: chrome://chrome-urls/
How Does this Help QA?
There are some useful items here for QA. Here's a few that I encountered.
Chrome Flags - This is where you can see all the experiments available in the current browser. This is useful to check on every once in a while. You can find out what new tools are may get released soon and you can play with them.
Accessibility - This allows you to take a deep dive in Chromes Accessibility based on what's loaded up right now. You can find out more about Accessibility testing that's available in Chrome on the Accessibility Page.
User Action - This is useful when you want to see how Chrome responds to certain keyboard/mouse actions.
Inspect - You can setup the Port Forwarding. Useful when you need to debug an issue on a particular server. You don't have to change your system settings, simply enable it at the browser level.
Net-Export - If you need to do a data dump of web activity, this is the place to get it done. Simply enable the logging and perform the activity. A full dump of all the activity will be dump into a JSON file. This is useful when a developer may not be able to reproduce the error on their end, and they may find something in the logs to explain why.
Dino - Everyone's favorite Dino game is available whenever you want.
Fun to Explore
Take some time to check out all 85 links on the Chrome URLs page.
Again, to access the page type this URL in the Browser URL field: chrome://chrome-urls/
